
It’s not a surprise that many students have difficulties with the notions of demand and supply. Let’s say, your instructor asks you to plot the demand and supply curves and tell how the increase of taxation affects demand and supply. And what comes to your mind? If nothing really useful, this article will shed light upon these issues. Here, we tell you about how to plot the demand and supply curves and how to correctly analyze them.
Let’s start with the definition of the demand, which actually simply appears to represent the dependence of the number of purchases, which the buyers are willing to make at a certain time, on the price level that affects their willing. Demand can be easily shown in table form. For example, let’s consider a demand schedule for potato:
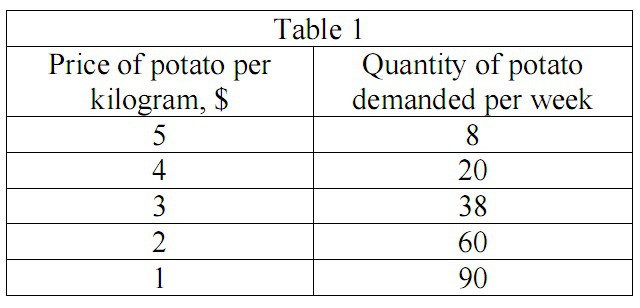
Let’s use our data from Table 1 and plot the demand curve:
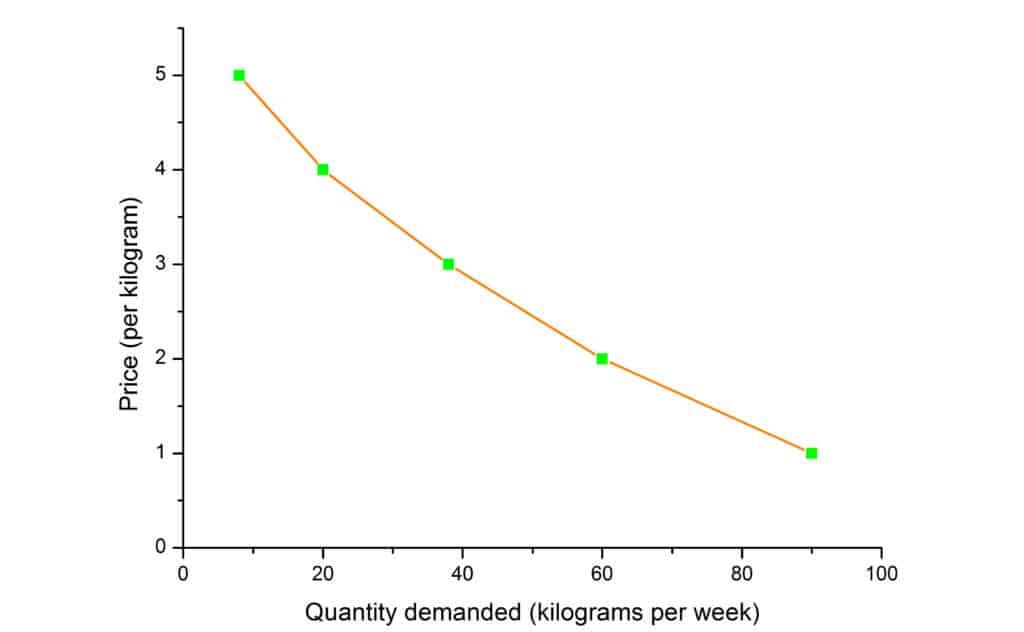
We can see from the graph that the demand curve has a downward slope. It means, that if the price is increasing, the quantity of demand is decreasing and vice versa. Also, from the graph, we can see that increase in demand leads to the shift of the demand curve to the right, and the decrease in the demand causes the shift to the left.
Let’s now consider the definition of supply. Supply is a dependence of the quantity of a product, which producers can make available for sale at a certain time, from the price level of a product. Let’s consider a supply schedule for producer of potato:
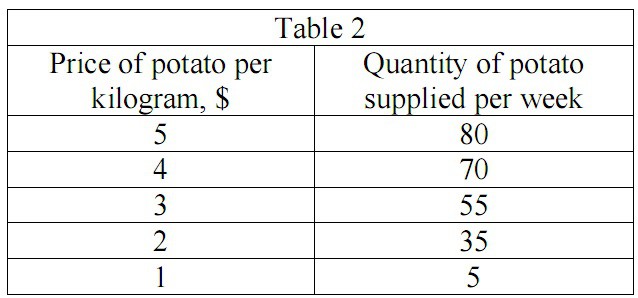
Then, we can use our data from Table 2 to plot the supply curve:
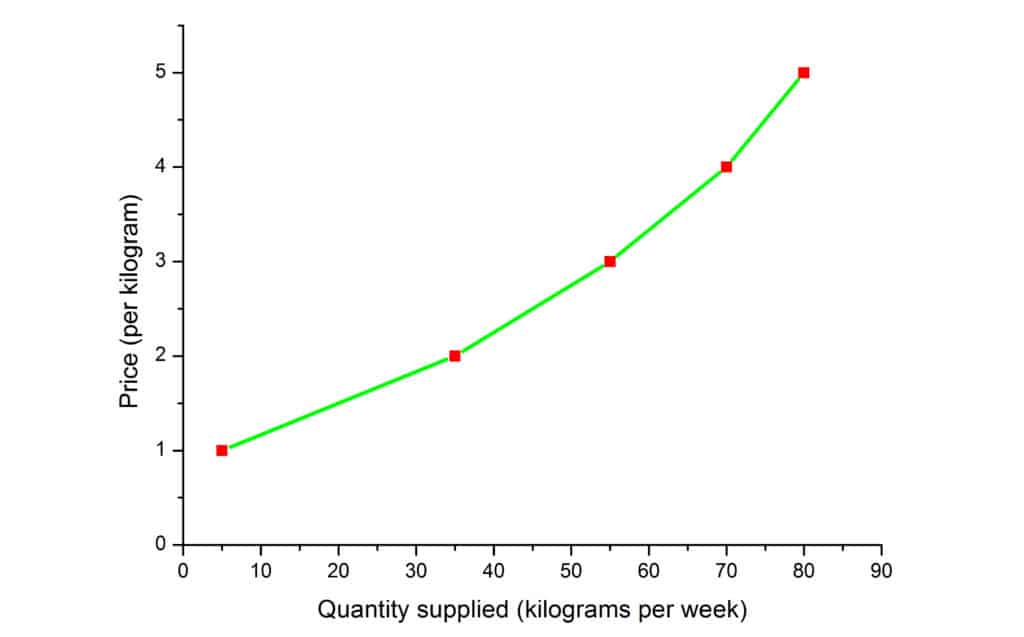
We can see from the graph that when the price rises, the quantity supplied rises as well and when the price falls, the quantity supplied falls correspondingly.
Now, let’s combine these two graphs:
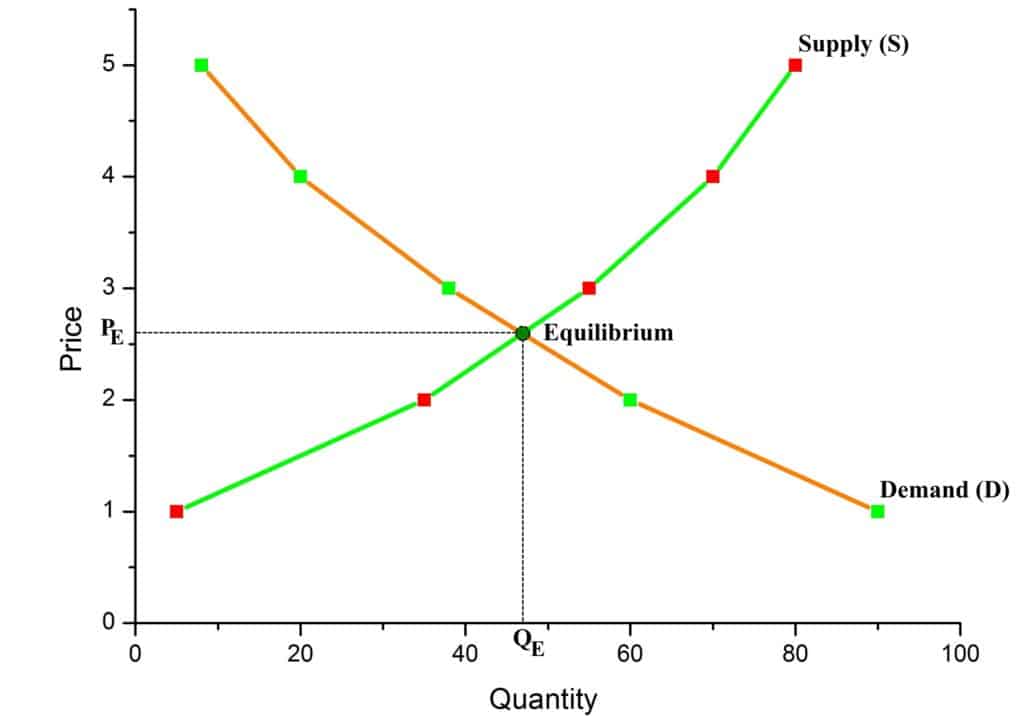
As it is seen from the graph, the point of intersection of the demand and supply curves for a product (in our case, for potato) indicates the market equilibrium. If we draw a perpendicular from the point of equilibrium to both axis, we can find the equilibrium price (P_E = \$\,2.62) and the equilibrium quantity (Q_E = 47\, kg).
Let’s consider how the increase in taxes affects the demand and supply curves. Let’s suppose, that the function of demand of potatoes is given by Q_D = 20 – P and the function of the supply of potatoes is given by Q_S = 4P – 5. Your instructor asks you to determine P_E and Q_E and plot the demand and supply curves if the government has imposed an indirect tax at a rate of \$\,1.25 from each sold kilogram of potatoes.
First, let us calculate the equilibrium price and equilibrium quantity that were before the imposed tax. It is obvious, that Q_D = Q_S and we get:
20-P=4P-5.
Then, from this equation we can find that P_E=\$\,5. Substituting P_E into the equation for Q_S we get Q_E:
Q_E=4\times 5 – 5 = 15\,kg.
In the case of an indirect tax, we need to modify our function of supply (since the tax is collected from the sellers, the demand function will not change). Now we should express the price P without taxation through the new price level P_1, when the indirect tax is taken into account: P = P_1 – 1.25. Then, substituting P into the function of supply Q_S, we get:
Q_S = 4P – 5 = 4(P_1 – 1.25) – 5 = 4P_1 – 10.
Finally, we can calculate the new equilibrium price and equilibrium quantity:
Q_D = Q_S,
20 – P_1 = 4P_1 – 10,
P_{E1} = \$\,6, Q_{E1} = 14\,kg.
Let’s outline our analysis on the graph:
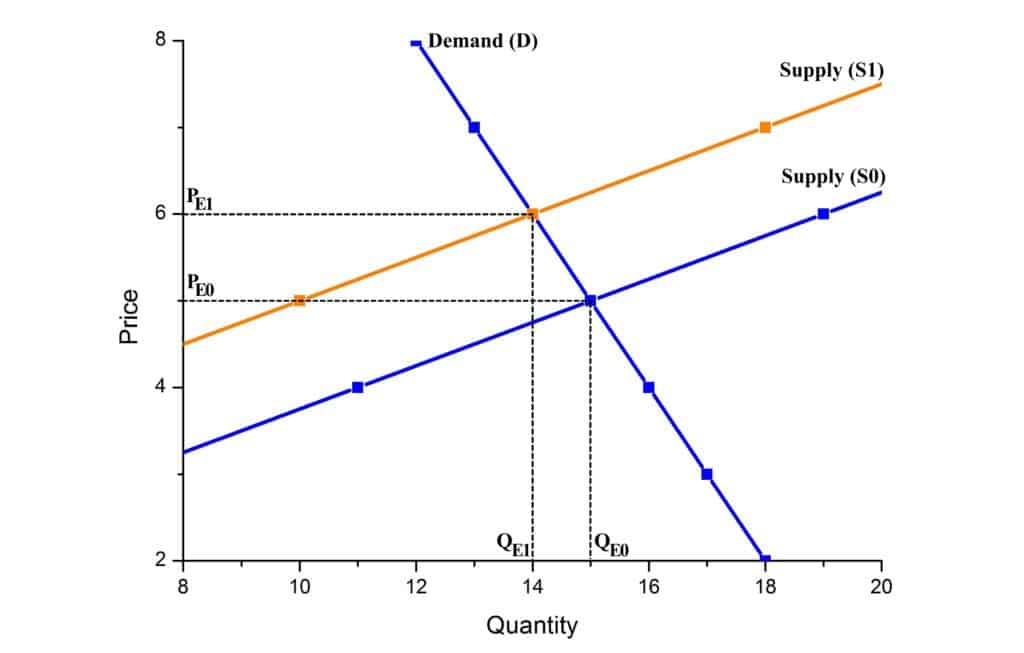
From the consideration of the graph, we can see that after imposition of the tax, the supply curve shifts up and to the left (initial curve marked as S0 and the final one as S1). The new equilibrium price and the equilibrium quantity is P_{E1} = \$\,6, Q_{E1} = 14\,kg.
As you may see it seems not so difficult and we are glad to help you!

